The standards report is designed to help you identify potential trends with your students’ performance against the Reading Informational Text standards.
This “radar chart” is most useful when the time duration is long enough to give students a chance to answer many questions against many learning standards.
The blue outer ring of data points represent the number of times a question for that standard was available.
The yellow data points represent the number of times students attempted to answer a question that was testing for that standard.
The green data points are the number of times students got the questions correct.
How to interpret this graph
Note: If students have not answered enough questions, interpreting this graph may not be useful.
The general idea is that you should look for areas where there are many attempts but fewer correct answers.
For example, if there were 10 available questions for each of the standards, and students attempted 8 and mostly got 6 correct, but for a single standard the correct answers were much less, you would see a dip in the green ‘correct’ compared to the yellow ‘attempted’ which could indicate a potential issue with that specific standard.
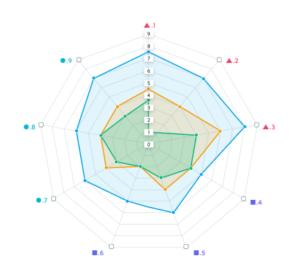
Example Chart
In the above example, note that there is a large difference between the number of .2 standards attempted by students and answered correctly. This gap could indicate that the class is having potential issues understanding how to interpret the .2 standards. (The .2 standard for example is a Key Ideas and Details standard – “Determine central ideas or themes of a text and analyze their development; summarize the key supporting details and ideas.”)
Show All Questions
By default, we do not show the blue outer ring for all questions that were available for each of the standards. This allows you to see just the attempted and correct answers for the pupils in the class over the time period selected. For cases where there were many more questions available than were answered, hiding the all questions blue data zooms into the answered data.
Differences in Score Totals in Standards vs. Overall Grade ScoringSince some questions do not test against a reading standard, such as the vocabulary question, the data in this graph may not align to the total number of correct answers the classes total score. There are typically only 5 questions with standards tested each day plus one vocabulary question without a standard, for a total of 6 questions.
For illustrative purposes, if all students answered all questions correctly EXCEPT for the vocabulary question, this chart would suggest that the students got all the questions correct because it would all be green.


